
Data. It’s a word that most of us use daily—whether we’re in the office or at home.
And with the constant invention of new tools that create, share, and use it, along with the continual increase in processing speeds and bandwidths, the amount of data out there is enormous and unending.
How enormous and unending?
It’s estimated that in 2020 each of us creates about 1.7 MB of data… Every. Single. Second. By 2025, the world is predicted to produce a whopping 175 trillion gigabytes of it.
As businesses continue to digitally transform, they’re not only gaining access to more of their own data than ever before, but they’re also acquiring better ways to organize and action that intelligence. This is an important development.
Because what good is having all the business data in the world if you can’t put it to good use?
With digital transformation comes the opportunity for increased data clarity. And that clarity enables businesses to better understand their customers, their performance, and their overall health and growth trajectory.
These insights are especially important for subscription-based businesses that depend on building long customer lifecycles and recurring revenue to establish scalability.
For such businesses, an important element of the digital transformation journey is implementing an adaptive billing solution.
Any subscription billing platform worth its salt includes good reporting capability. And while recurring billing data satisfies accounting and revenue reporting requirements, of course, it also does so much more.
With the help of a robust billing platform like Stax Bill, detailed reporting makes it possible to identify and organize actionable insights from recurring billing data that can drive subscription business objectives and strategic decisions.
1. Identify sales trends and forecast results.
Your subscription business’s sales data represents the total amount you’ve invoiced your customers. Your recurring billing software should be able to generate reports for various time periods so that you can break that data down by day, month, quarter, and year for both your net and gross sales.
Viewing the data in these various time increments is a powerful way to start identifying trends and forecasting results. And it’s especially useful to be able to compare those different time increments to their historical equivalents if your subscription business has combinations of monthly and annual customers.
It can really help to reveal more consistent patterns in your sales activity, which in turn will help you predict what to expect from sales in the future.
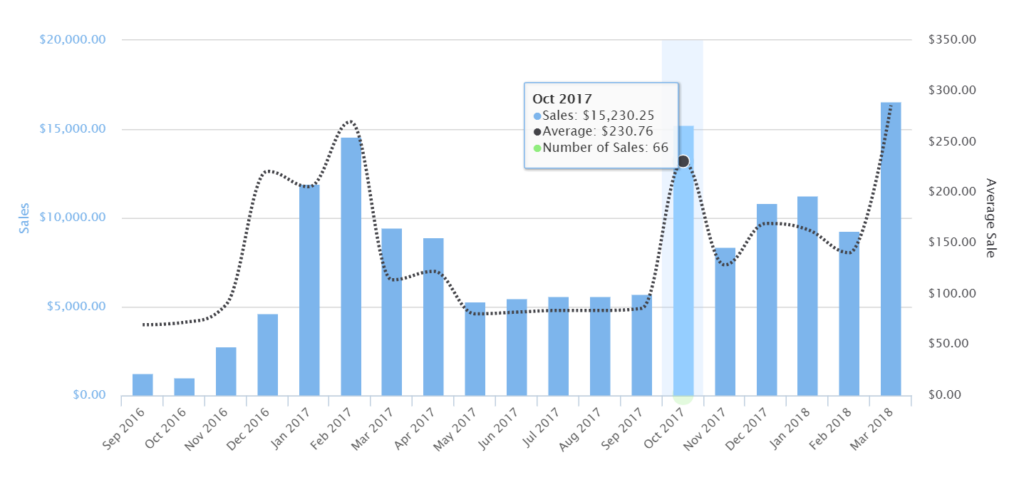
Consider the graph above, which shows sales data broken down by monthly increments. It’s hard to see any clear trends in the data…
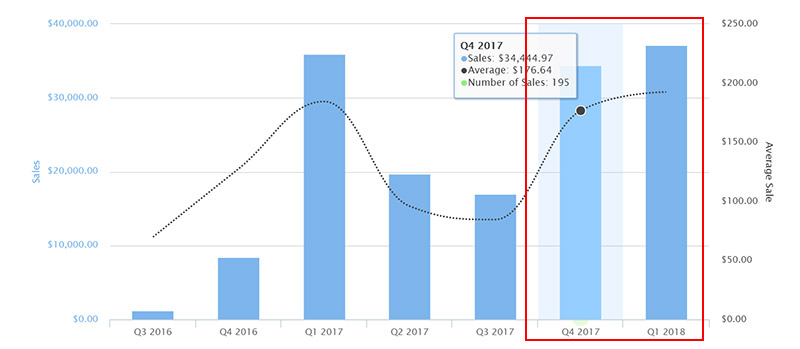
But if that same sales data is broken down by quarterly increments, a pattern of growth begins to emerge through Q4 and Q1.
2. Catch issues with customer base diversity before it’s too late.
One major threat to subscription businesses is relying too heavily on just a few customers for recurring revenue. If these top customers reduce their spend, go out of business, or switch to a competitor, your revenue could take a major hit.
It’s important to know what percentage of your business’s revenue comes from each customer—especially if you have just a handful of really big ones—and whether you need to diversify your customer base.
Reporting on your sales by customer makes it easy to identify whether this issue exists. You can view gross sales, discounts, reversals, and net sales by customer for a high-level view of your biggest customers, highest sales values, and the dollar value of sales per customer.
Comparing gross sales and net sales by customer clarifies who the biggest contributors really are. Consider the following example.
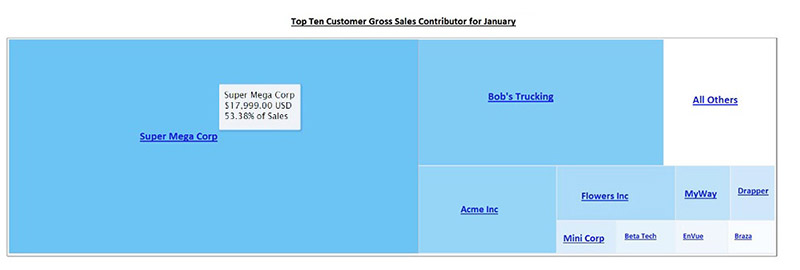
When we look at this company’s gross sales by customer, we see that the company is heavily dependent on its top ten customers for 80% of its business. In fact, its top customer alone—Super Mega Corp—brings in over 50% of its business from this perspective.
But if we look at the data by net sales and take discounting into account, we see a very different picture. Super Mega Corp is heavily discounted, and while it does contribute to about 10% of the company’s net sales volume, Bob’s Trucking is clearly the largest customer.
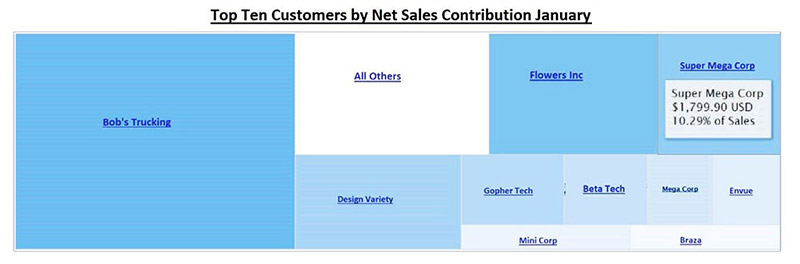
It’s clear where the business should be focusing its customer success efforts.
3. Use recurring billing data for important sales and marketing decisions.
It’s extremely useful to have an awareness of your business’s sales progression. And being able to view your monthly sales, including the number that happened and the dollar amount, offers deep insight into your team’s performance over time.
What were your actual sales as the months have gone by, and how is your business trending? Graphical views of this data can help quickly reveal and make sense of seasonal performance to identify whether sales pick up or slow down at certain times.
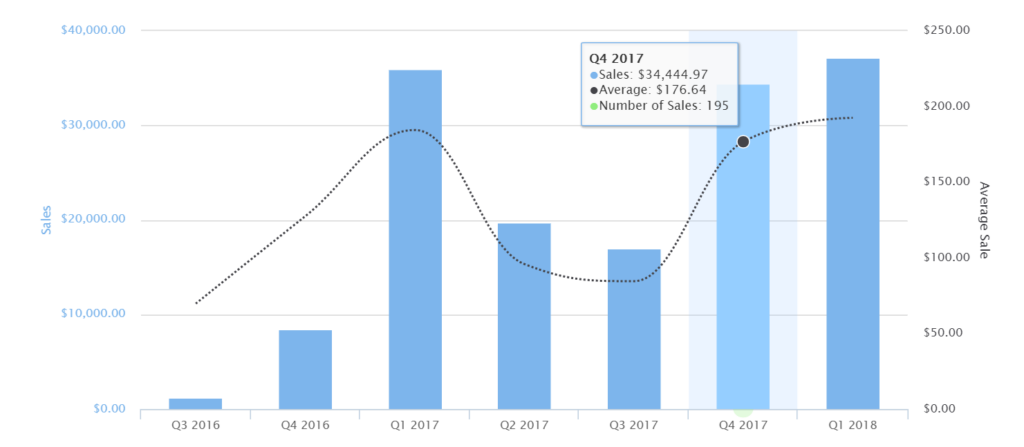
For example, this graph shows sales data by quarterly intervals and there’s a pattern of strong Q1 performance over time, and significant Q4 growth.
Quick access to visual data like this helps provide justification for important sales and marketing decisions. It also helps your team establish realistic sales and budgeting targets or determine whether it’s time to refocus efforts on increasing average sales or sales volume.
4. Gauge and improve marketing strategy and success.
Another way to break down your business’s data is by your subscription plans. This allows you to see which plans are your top sellers, and which aren’t doing quite as well.
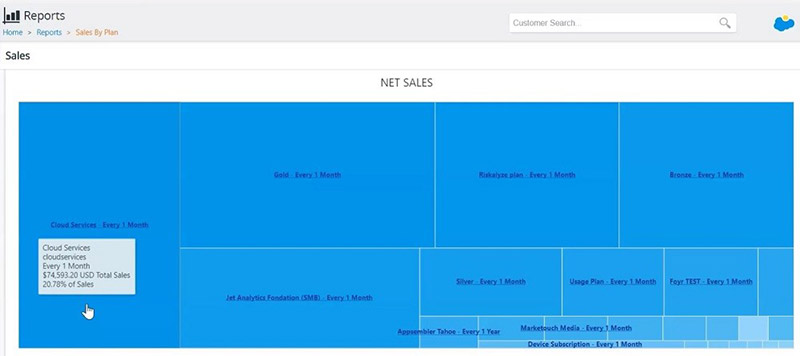
With this information, you get an unobstructed view of which plans customers really want, not just which ones you think they want, and also which types of plans are selected most often. For example, do your customers prefer your monthly or annual payment option for a specific plan?
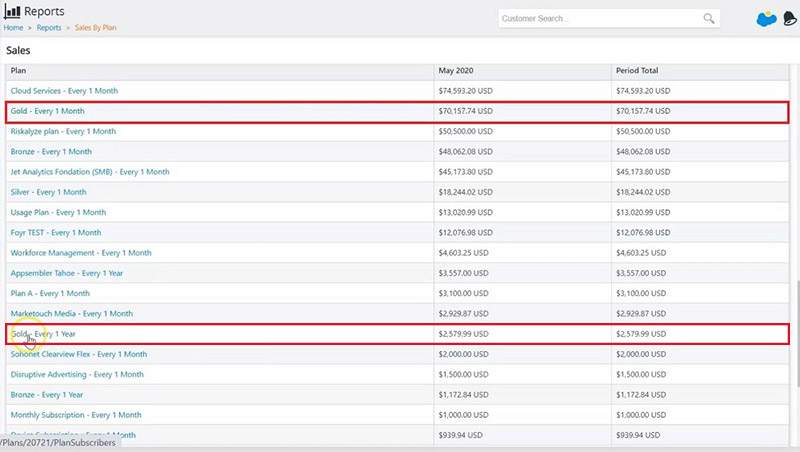
Consider this view of the same data. This business’s Gold monthly plan is a top seller that brought in over $70,000, or about 20% of the total sales for this period. The annual version of the same plan—which wasn’t even visible on the graphical view above—only brought in around $2,500 in sales for the same period.
All of this helps your team understand which of your offerings are high-demand revenue generators and should take a front seat in your marketing efforts. It also creates opportunities for your team to adjust its pricing strategy accordingly, and perhaps capitalize on the plans you sell most.
If you recently rolled out a new plan, this kind of reporting also helps you ascertain whether marketing efforts are working as planned. And the same goes for products.
Digging into products in addition to plans is another great way to gain valuable insight from your data. After all, your products are your business’s individual streams of revenue.
Aside from what’s most popular, are there specific features or physical products customers are consistently purchasing alongside their subscription plans? Is there an opportunity to enhance and add a premium to your plans by including add-on products by default?
Or perhaps you’ll notice customers are consistently purchasing a lot of add on products over and above their chosen plans, so perhaps offering an a la carte or usage based option would be a great new opportunity for growth.
5. Track activation cohorts to predict and mine for future revenue.
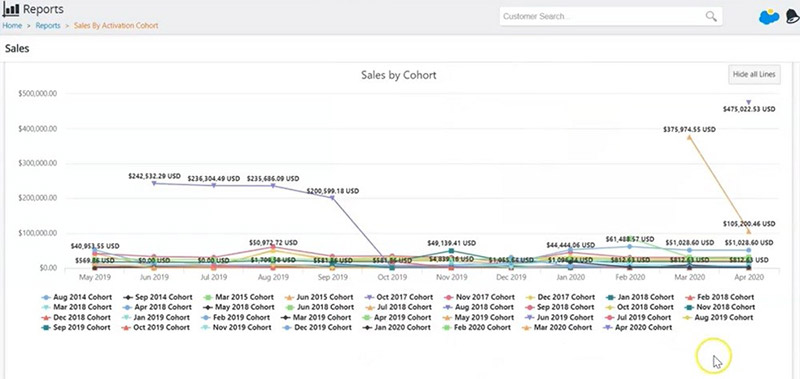
An activation cohort is a group of customers that activated their subscriptions in the same month. And your subscription business’s activation cohort data is a powerful predictor of future revenue.
With activation cohort data, you can see what percentage of customers and what dollar value from each cohort are still subscribers. You can also see which have expanded, churned, or remained a steady source of recurring revenue.
This information enables you to pinpoint particular cohorts that fizzled out so you can try to identify why. You can also identify which cohorts expanded—or upgraded their subscriptions—so you can determine whether the reasons for their expansion can be replicated to encourage recurring revenue growth from other cohorts.
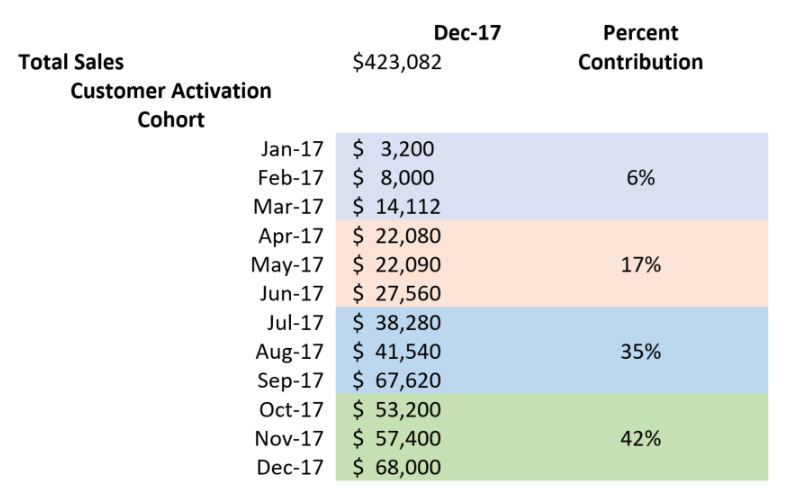
Activation cohort data also shows you how much of your revenue is coming from long-term customers versus newer ones. This enables you to establish baselines for the percentage of anticipated sales volume from your customer this period and into the future.
6. Monitor and track your churn
Tracking your activation cohort activity can also help you monitor and track your business’s churn rate.
Monitoring your cohorts helps you identify which month during your customer lifecycle the most churn tends to happen. With this information, your subscription business can time mitigation tactics. Even modest improvements to your retention rates can help you recover around 10-15%—or more—in annualized sales.
You can also compare sales churn to subscriber churn—an important distinction to make.
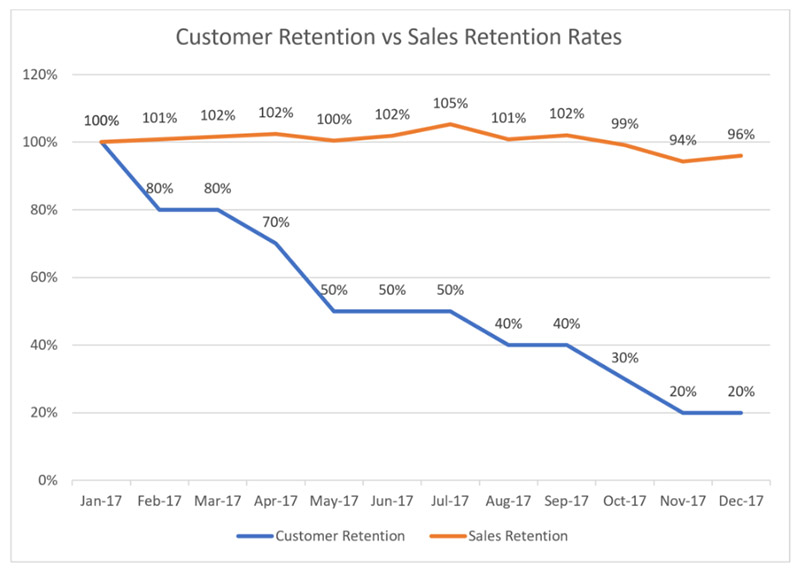
For example, in the above report, we see many customers churning out, yet sales are stable. So what’s happening there?
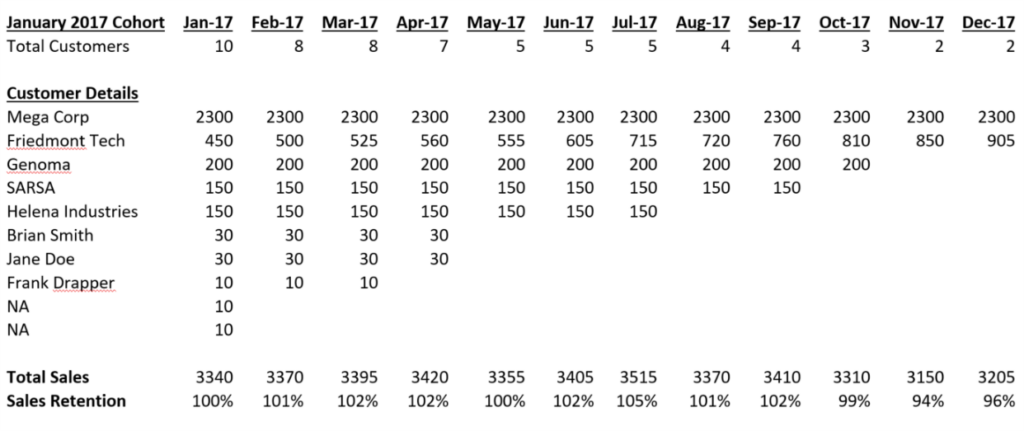
A closer look reveals this business is retaining its better-quality customers, which are expanding or increasing usage and keeping sales high.
You can use this information to identify enterprise customers worth nurturing. It also gives you some insight into the types of customers that stick around. These are the types of customers your marketing and sales teams should be going after.
Make your recurring billing data deliver results
Subscription businesses are continually creating recurring billing data. And that data—when collected, organized, and used effectively—provides incredible business intelligence.
While many still struggle with managing the vast amount of business information available, having a sustainable data model is becoming the requirement to compete in the quickly evolving business landscape.
A digital transformation that includes the integration of an adaptive recurring billing platform like Stax Bill enables businesses to make the most of their data. These businesses derive insights, create strategies, and make future organizational decisions to create competitive advantages based on information rather than assumptions. Data-driven action is the key to subscription business success.